
Content Creation Tools Used
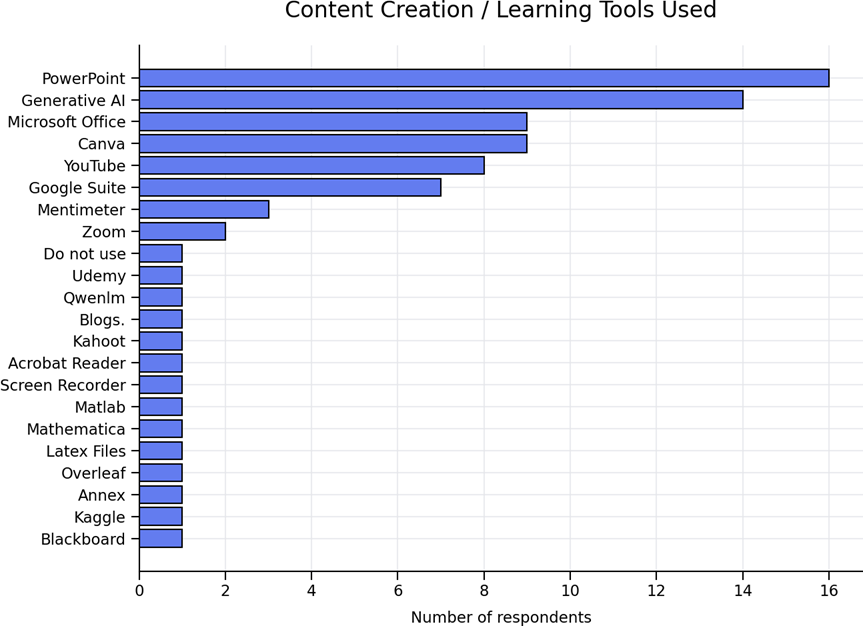
The chart shows the distribution of content creation and learning tools currently used by respondents in higher education teaching and learning practice. Traditional tools remain dominant, with PowerPoint the most frequently cited resource, indicating its continued central role in instructional design. However, the high prevalence of Generative AI tools—encompassing platforms such as ChatGPT and Copilot—highlights a significant shift toward AI‑supported content development. Canva and Microsoft Office also feature prominently, suggesting widespread adoption of visual design and productivity tools to support inclusive and accessible materials. The relatively strong use of YouTube further reflects the importance of video‑based resources in contemporary teaching. Overall, the pattern indicates a blended ecosystem in which established presentation software coexists with rapidly emerging AI‑enabled tools, with clear implications for staff development, accessibility guidance, and institutional digital strategy.
Most Relevant Parts of the Toolkit
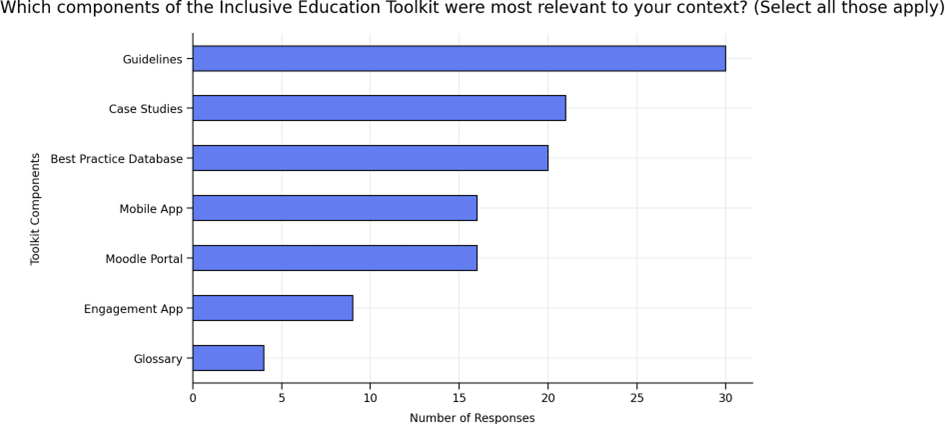
The bar chart shows how frequently different components of the Inclusive Education Toolkit were identified as most relevant by respondents. Guidelines are the most commonly selected component, followed closely by Case Studies and the Best Practice Database, indicating a strong preference for practical, example-based resources. Mobile App and Moodle Portal are also widely mentioned, suggesting interest in digital and platform-based support. Less frequently selected components, such as the Glossary and Engagement App, still appear across responses, highlighting the Toolkit’s broad relevance across diverse needs and contexts.
Tools Particpants Plan to Use or Share
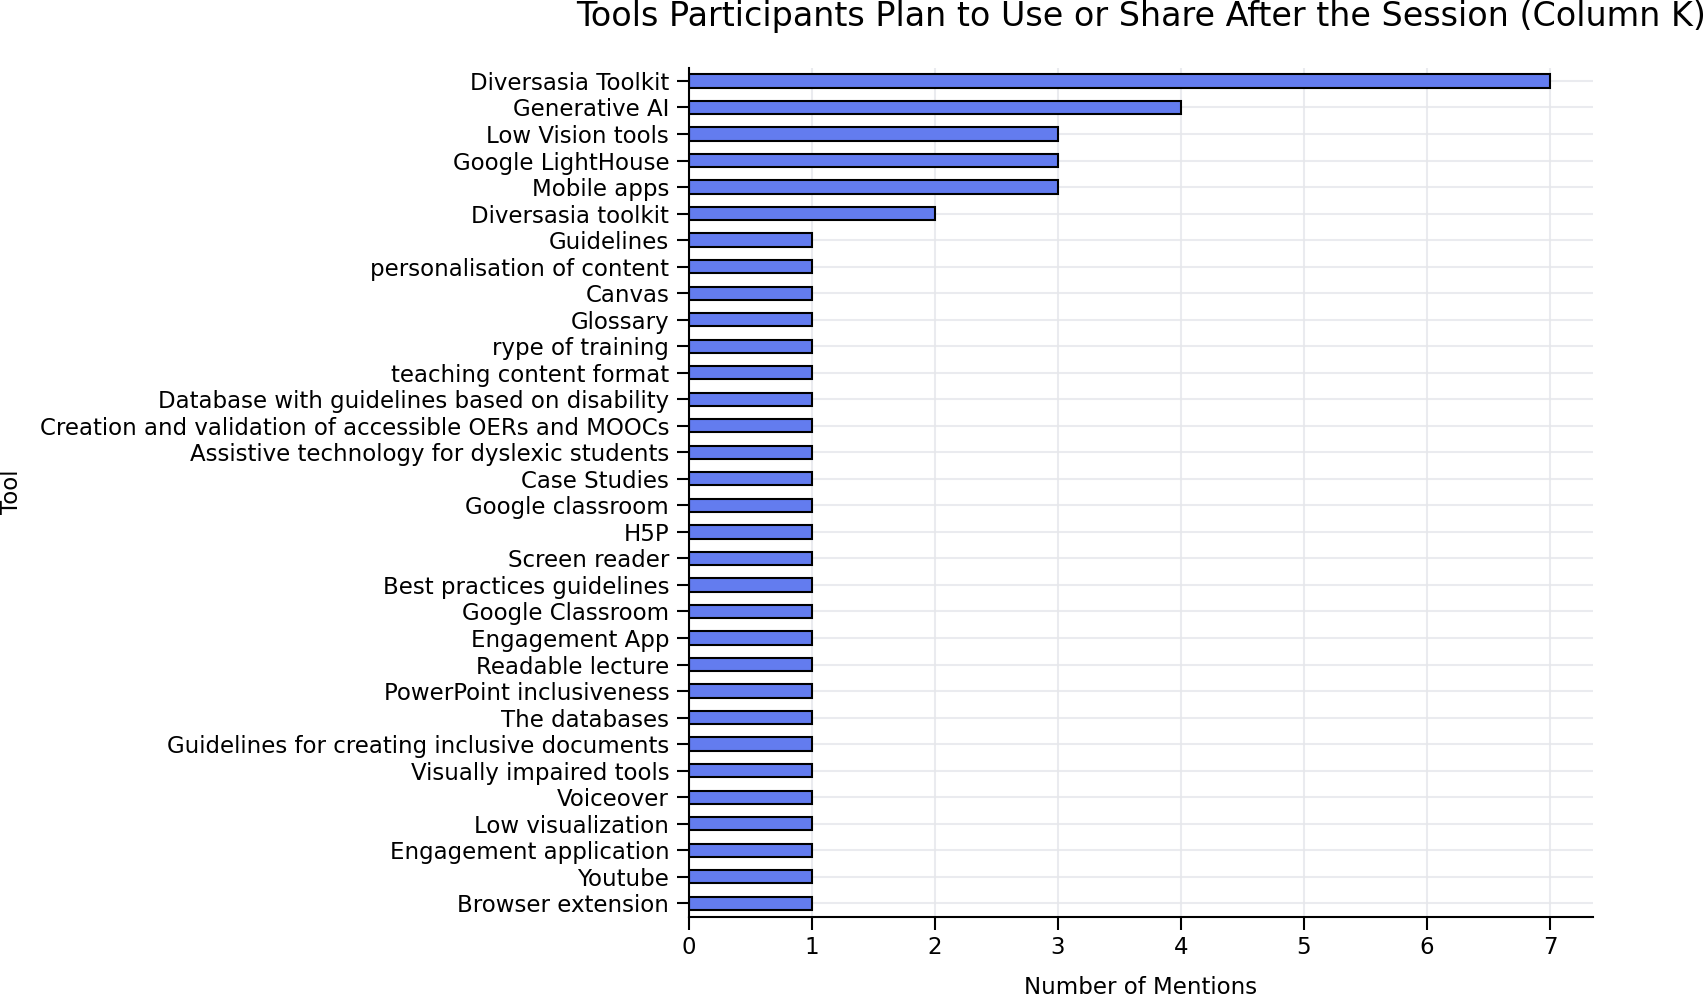
The chart shows which tools participants plan to use or share after the session. The Diversasia Toolkit is the most frequently mentioned tool, showing that it is the main resource participants intend to use or promote. Generative AI tools are the next most common, indicating strong interest in using AI to support inclusive teaching.Several participants also plan to use mobile apps, Google Lighthouse, and low‑vision support tools, suggesting a focus on accessibility and flexible digital solutions.
Many other tools are mentioned only once, such as screen readers, H5P, accessibility toolkits, and assistive technologies for specific needs. This shows a wide range of interests, but with smaller numbers exploring more specialised tools.
Overall, the chart suggests that participants are most interested in practical toolkits and digital technologies that support inclusive and accessible learning, while also experimenting with a variety of more specific tools depending on their local needs.
Confidence in Preparing Inclusive Learning Materials
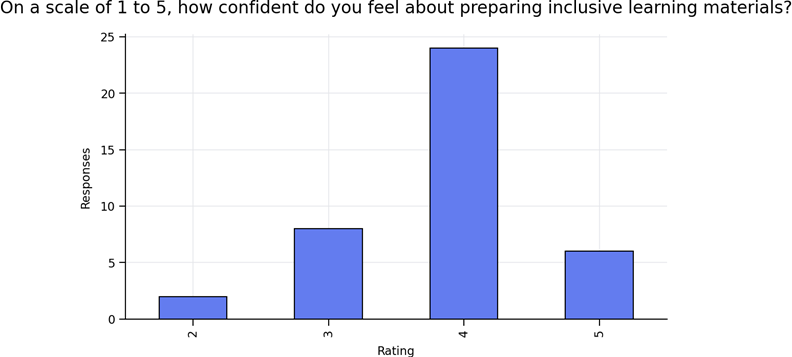
Most respondents reported medium to high confidence (ratings 3–5) in preparing inclusive learning materials.
Understanding the Purpose of the Toolkit
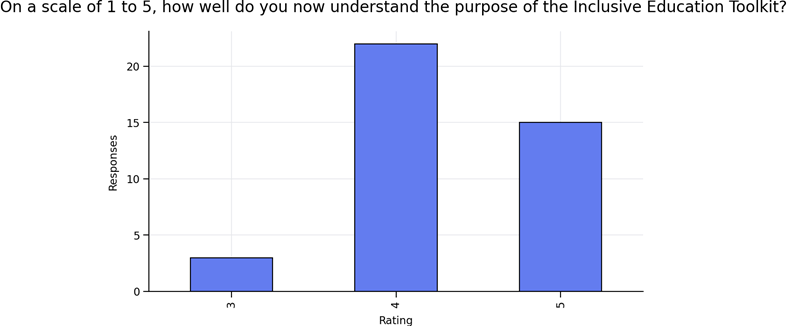
Ratings indicate a strong understanding of the purpose of the Inclusive Education Toolkit following the workshop.
Confidence in Applying Inclusive Education Principles
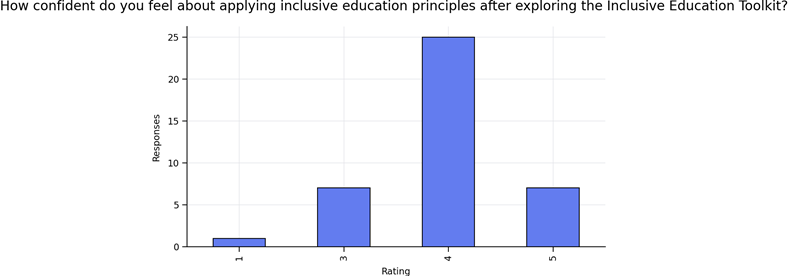
Participants generally expressed high confidence in applying inclusive education principles after engaging with the Toolkit.
Awareness of the Toolkit Before the Workshop
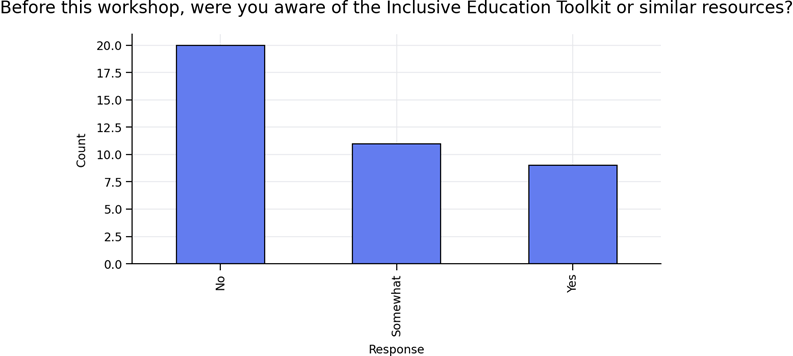
Responses show mixed levels of prior awareness, underlining the importance of dissemination activities.
Likelihood of Integrating the Toolkit in Future Practice
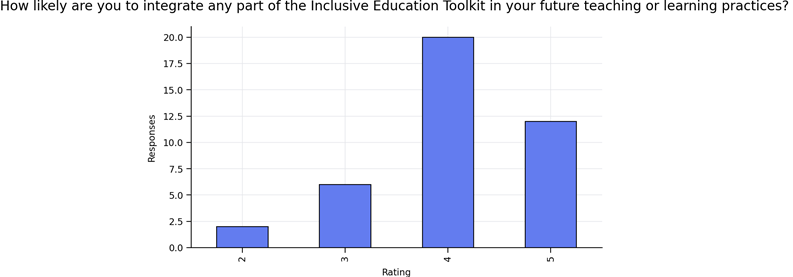
Most respondents indicated a high likelihood of integrating Toolkit resources into future practice.